

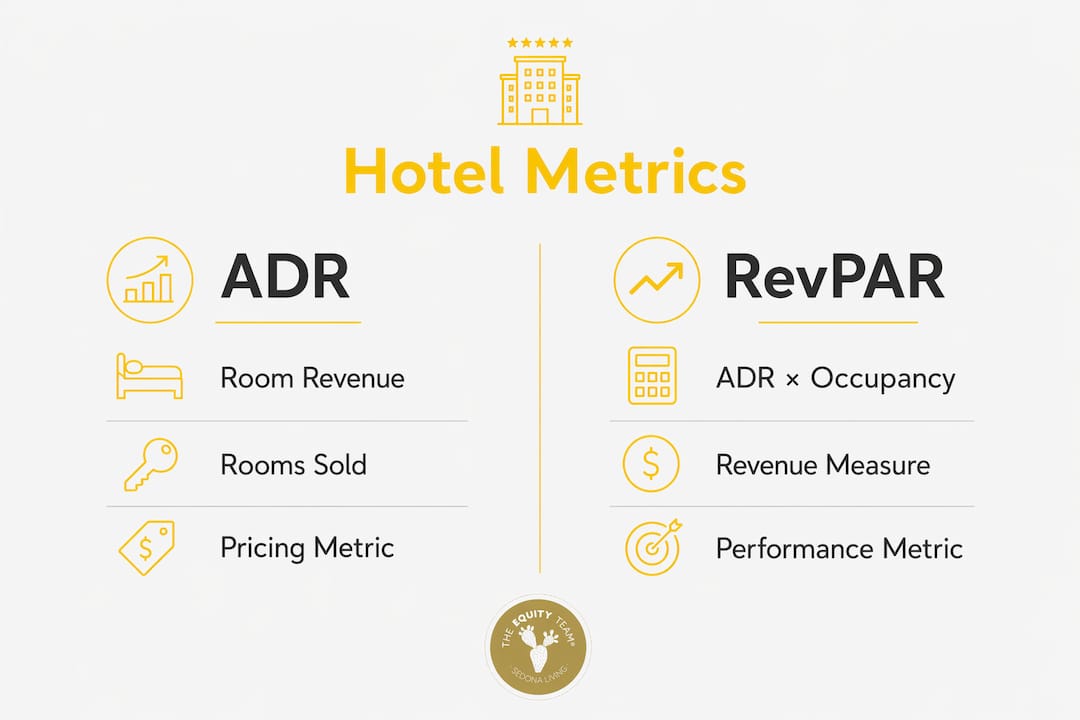
Average daily rate (ADR) is the average revenue a property earns per paid occupied room over a chosen time period, calculated with one clean formula: ADR = Total Rooms Revenue ÷ Total Rooms Sold. A quick example: $12,000 in room revenue divided by 120 rooms sold gives you an ADR of $100. That single number tells you how efficiently you’re pricing the rooms guests actually sleep in, which makes it one of the most watched metrics in hospitality and short-term rental investing.
A few things worth knowing right up front:
- Complimentary rooms, out-of-order rooms, and overnight staff rooms are excluded from “rooms sold” per USALI conventions, keeping the denominator clean.
- ADR works alongside occupancy and RevPAR (Revenue Per Available Room) to give a full picture of property performance. No single metric tells the whole story.
- For Sedona STR investors, ADR is the starting point for any pro forma. Equity Team builds revenue projections from it every time a client evaluates a property.
Table of Contents
- What is average daily rate and how does the formula work?
- How to calculate ADR step by step
- How ADR compares to RevPAR and ARR
- What actually drives ADR up or down?
- Why ADR alone can mislead you
- Practical ways to push ADR higher
- How ADR works in STR investment analysis
- Your copyable ADR worksheet and reporting checklist
- Key Takeaways
- ADR in practice: a note from the field
- Equity Team helps Sedona investors put ADR to work
- Useful sources
What is average daily rate and how does the formula work?
ADR measures the average rental revenue earned per paid occupied room. It does not count empty rooms, comped stays, or rooms pulled from inventory for maintenance. That exclusion is the whole point: ADR reflects pricing performance on revenue-generating nights only.
The formula is simple enough to run in your head:
“Total rooms revenue” means all room charges collected from paying guests during the period. “Total rooms sold” is the count of paid occupied room-nights, nothing else. Rack rates, discounted rates, group rates, and promotional rates all roll into the revenue numerator, because ADR aggregates across all paid rate tiers for occupied rooms.
How to calculate ADR step by step
Here’s a reproducible procedure you can copy straight into a spreadsheet.
- Collect total rooms revenue for the period. Pull only room charges. Strip out food and beverage, parking, spa, and cleaning fees unless your accounting system bundles them into the room rate (in which case, separate them first).
- Count rooms sold. Tally every paid occupied room-night. Exclude complimentary rooms, out-of-order rooms, and staff rooms per USALI guidance.
- Choose your period. ADR can be computed for a single day, a week, a month, or any custom range. The formula is identical; only the inputs change.
- Divide. Rooms revenue ÷ rooms sold = ADR.
- Sanity-check with RevPAR. Multiply your ADR by occupancy rate. If that number matches your RevPAR report, your inputs are clean.
Worked example
| Line item | Value |
|---|---|
| Complimentary rooms excluded | 5 |
| Out-of-order rooms excluded | 3 |
| Total rooms sold (paid) | 120 |
| ADR | $108.33 |

Edge cases to watch: Group blocks contracted at a flat rate still count as paid rooms. Refunded nights should be removed from both revenue and rooms sold. Packages that bundle breakfast or activities into a single room charge need to be unbundled before calculating ADR, with only the room portion counted as rooms revenue.
Pro Tip: Paste this formula into Google Sheets: =B8/B9 where B8 is total rooms revenue and B9 is total rooms sold. Add a RevPAR check in the next cell: =ADR_cell * occupancy_rate. If RevPAR matches your PMS report, your data is clean.
How ADR compares to RevPAR and ARR
These three metrics look similar on the surface but answer different questions.

| Metric | Formula | What it measures | Best used for |
|---|---|---|---|
| ADR | Rooms revenue ÷ Rooms sold | Pricing efficiency per occupied room | Rate strategy, pricing benchmarks |
| RevPAR | ADR × Occupancy rate | Top-line revenue across all available rooms | Portfolio performance, investor reporting |
| ARR | Same as ADR | Average revenue per occupied room | Longer reporting periods (monthly, annual) |
RevPAR is ADR multiplied by occupancy rate and is widely considered the industry gold standard for measuring top-line performance across a property or portfolio. ADR tells you how well you’re pricing the rooms you sell. RevPAR tells you how well you’re filling and pricing all the rooms you have.
Using the $108.33 ADR from the worked example above: if occupancy is typical, RevPAR equals ADR multiplied by occupancy rate, illustrating the revenue impact of unsold rooms. That gap between ADR and RevPAR is the cost of every unsold room.
ARR uses the identical formula as ADR but tends to appear in longer-period reporting contexts, like monthly or annual summaries. In daily operations and short-term rental analysis, ADR is the standard term.
- Use ADR when evaluating pricing strategy and rate mix.
- Use RevPAR when comparing properties or measuring total revenue efficiency.
- Use ARR when presenting annual performance summaries to stakeholders.
What actually drives ADR up or down?
A lot of operators watch their ADR move without fully understanding why. Here are the primary levers:
- Seasonality and demand cycles. Peak travel periods push ADR up naturally. In a market like Sedona, spring and fall shoulder seasons can produce dramatically different ADRs than summer heat or winter holidays. Knowing your demand calendar is half the battle. Check out how Sedona STR pricing during active bookings shifts across the year for a local perspective.
- Location and market mix. Properties in high-demand corridors command higher rates. Proximity to trailheads, red rock views, and town amenities all factor into what guests will pay.
- Room-type distribution. A property with more premium room categories will naturally carry a higher ADR than one dominated by standard rooms, even at similar occupancy.
- Channel mix. OTA bookings often come with commission costs that erode net ADR. Direct bookings at the same rate produce more revenue per occupied room. Shifting the channel mix toward direct can lift effective ADR without changing posted rates.
- Group vs. transient mix. Group rates are typically negotiated below rack, which pulls ADR down. A heavy group week can look great for occupancy while quietly compressing ADR.
- Promotions and corporate rates. Discounted rate tiers are included in the ADR calculation. A promo-heavy month will show lower ADR even if demand was strong.
- Packaging and ancillaries. Bundling services into the room rate (breakfast, spa credits, early check-in) can support higher posted rates, but only if the room-revenue portion is tracked separately.
Pro Tip: Watch for weeks where occupancy spikes but ADR drops. That’s usually a sign that heavy discounting or a group block filled the calendar. The outdoor amenities that support higher ADR in Sedona STRs are a good example of how property features can reduce your dependence on discounting.
Why ADR alone can mislead you
ADR is a useful number, but it has a few blind spots that trip up operators and investors alike.
- It ignores unsold inventory. A property with a $200 ADR and 40% occupancy is underperforming a property with a $150 ADR and 85% occupancy. ADR never shows you the empty rooms.
- It’s a lagging indicator. ADR reflects what already happened, not what’s coming. By the time a rate problem shows up in ADR, the revenue opportunity has already passed.
- Comparing across property mixes is tricky. A boutique with all suites will have a higher ADR than a midscale property with mostly standard rooms. Comparing those two ADRs without context tells you almost nothing useful.
- Comps and miscounts corrupt the denominator. Including complimentary rooms in “rooms sold” inflates the denominator and artificially depresses ADR. Sloppy data hygiene is one of the most common calculation errors.
- Channel costs aren’t reflected. A $150 ADR booking through an OTA that charges 18% commission nets you $123. A $140 direct booking nets you $140. Net ADR after distribution costs is the number that actually matters for profitability.
“ADR alone gives an incomplete picture. Pair it with occupancy and RevPAR to understand whether higher rates are sustainable or simply a byproduct of lower volume.” — Investopedia
Always view ADR alongside occupancy rate, RevPAR, and GOPPAR (gross operating profit per available room). Tracking ADR trend versus market ADR is also worth building into any regular reporting cadence. Common pricing mistakes in Sedona real estate often trace back to operators watching ADR in isolation.
Practical ways to push ADR higher
These are the tactics revenue managers actually use, not theoretical suggestions.
- Dynamic pricing. Adjust rates in real time based on demand signals: booking pace, local events, competitor availability. Most property management systems and channel managers support this natively.
- Rate fencing. Create distinct rate tiers tied to conditions (non-refundable, minimum stay, advance purchase). Guests who want flexibility pay more; bargain hunters get a lower rate with restrictions.
- Packaging and upsells. Offer add-ons at booking: early check-in, late checkout, welcome packages, guided experiences. These support a higher total transaction value and can be structured to lift the room-rate component. For STR operators, maximizing ROI on Sedona investment properties often starts here.
- Room-type segmentation. Price each room category distinctly based on its features and demand. Don’t let a premium room sell at a standard rate because your pricing isn’t differentiated.
- Channel mix optimization. Push direct bookings through loyalty incentives, direct-booking discounts, and a strong website presence. Every percentage point shifted from OTA to direct improves net ADR.
- Minimum-stay controls. During high-demand periods, require a two- or three-night minimum. This filters out low-value single-night bookings that compress ADR and increase turnover costs.
- Discount management. Set a floor rate below which you won’t go, regardless of occupancy pressure. Filling rooms at deeply discounted rates can actually reduce RevPAR if the ADR drag outweighs the occupancy gain.
For each tactic, the metric that moves first is usually booking pace or lead time, not ADR itself. Give any pricing change at least two to four weeks before drawing conclusions from ADR data. Track average length of stay, booking lead time, cancellation rate, and channel commission impact alongside ADR to get a complete read on whether the tactic is working. Good STR management practices treat ADR as one output of a system, not the lever itself.
How ADR works in STR investment analysis
For investors, ADR is the foundation of any revenue projection. The basic pro forma math is:
Projected Room Revenue = ADR × Forecasted Occupancy Rate × Available Nights
A Sedona STR projecting ADR, occupancy, and available nights can estimate annual room revenue before expenses, a key figure in financial modeling. That’s the number you stress-test against your acquisition cost, financing, and operating expenses to decide whether the deal works.
A few cautions specific to Sedona and similar destination markets:
- Seasonality skews short-term ADR. A property that earns $350/night in March can drop to $180/night in July. Using a single month’s ADR to underwrite an annual projection is a fast way to get burned. Use multi-year local averages when building a pro forma.
- Event-driven demand is real but lumpy. Sedona’s festivals, retreats, and shoulder-season travel create ADR spikes that don’t repeat evenly. Model them separately rather than blending them into a flat annual rate.
- Regulatory impacts on available nights matter. Local STR permitting rules affect how many nights a property can legally rent. Fewer available nights means your ADR has to work harder to hit revenue targets.
Pro Tip: Before acquiring any Sedona STR, run the ADR × occupancy × available nights calculation using at least two years of local comparable data. Then run a downside scenario at 15% lower ADR and 10% lower occupancy. If the deal still pencils, you have a margin of safety. Equity Team’s STR investment property guide walks through exactly this kind of pre-acquisition checklist.
Your copyable ADR worksheet and reporting checklist
Spreadsheet formulas
| Metric | Formula (Google Sheets / Excel) | Notes |
|---|---|---|
| ADR | =B2/B3 |
B2 = rooms revenue, B3 = rooms sold |
| Occupancy % | =B3/B4 |
B4 = total available rooms |
| RevPAR | =B5*occupancy_rate |
B5 = ADR result, occupancy rate variable |
Data hygiene checklist (run before every calculation)
- Confirm revenue includes only room charges. Remove F&B, parking, and ancillary revenue.
- Verify rooms sold excludes complimentary, out-of-order, and staff rooms.
- Separate refunded nights from both revenue and rooms sold.
- Unbundle packages: isolate the room-rate component from bundled services.
- Confirm the date range matches across all data pulls (revenue report and occupancy report must cover identical dates).
Reporting best practices
- Daily ADR is useful for spotting anomalies and rate errors. Run it every morning.
- Weekly ADR smooths day-of-week variation and is the most useful operational cadence.
- Monthly ADR is the standard for investor reporting and year-over-year comparison.
- Round ADR to two decimal places and display with a dollar sign ($108.33, not 108.3333).
- Archive raw transaction data for at least three years. Audits and tax reviews will ask for it. Tools like Cloudbeds’ ADR calculator can help operators verify their manual calculations against a live tool.
Key Takeaways
ADR is the single most direct measure of pricing efficiency per occupied room, but it only tells the full story when paired with occupancy and RevPAR.
| Point | Details |
|---|---|
| ADR formula | Total rooms revenue ÷ total rooms sold (exclude comps, out-of-order, and staff rooms). |
| Main limitation | ADR ignores unsold inventory; a rising ADR with falling occupancy can reduce total revenue. |
| Essential companions | Always track ADR alongside occupancy rate, RevPAR, and GOPPAR for a complete performance picture. |
| Highest-impact tactic | Dynamic pricing and minimum-stay controls tend to move ADR fastest in high-demand STR markets. |
| Equity Team’s approach | Equity Team uses ADR × occupancy × available nights to build pro formas for every Sedona STR acquisition it evaluates. |
ADR in practice: a note from the field
Here’s a perspective worth sitting with: most investors who come to Sedona fixate on occupancy rate because it feels intuitive. Full calendar equals good investment, right? Not always. Occupancy is easy to manufacture with deep discounts. ADR is harder to fake.
The properties that consistently outperform in Sedona’s STR market tend to have a specific quality: they command a premium ADR even during shoulder season, not just during the obvious peak weekends. That’s the signal worth chasing. A property that holds $250/night in a slow July week is a fundamentally different asset than one that needs to drop to $120 to stay booked.
What investors should ask their agent: What is the trailing 12-month ADR for this property, and how does it compare to the top-quartile comps in this submarket? If the agent can’t answer that with actual data, that’s information too.
One more thing worth flagging: market ADR and property-level ADR are not the same number. Market ADR is an average across all properties in a comp set, including the underperformers. A property hitting market ADR is doing fine. A property beating market ADR by 20% or more is doing something right, and understanding what that is before you buy is the whole game.
Equity Team helps Sedona investors put ADR to work
Equity Team is the only STR-specialized real estate group in Northern Arizona, and the way the team works is pretty different from a generalist agent. Every property evaluation starts with ADR-based revenue modeling, local comp data, and a pro forma stress test before a client ever makes an offer.

If you’re evaluating a Sedona STR acquisition and want to see what the ADR numbers actually look like for specific properties and submarkets, Equity Team can pull that data and walk you through the underwriting. The team works exclusively with investors and represents clients operating in the top 10% of the Sedona rental market. Find the right STR investment for your goals, or browse current Sedona investment properties to see what’s available right now.
Useful sources
- Investopedia: Understanding Average Daily Rate (ADR) — canonical definition and formula
- CoStar: What ADR Is and How to Calculate It — USALI conventions, RevPAR relationship, ARR comparison
- Cvent: Hotel ADR Complete Guide — rate mix and practical hotel context
- Mews: ADR Average Daily Rate — revenue management practitioner perspective
- Cloudbeds: ADR Calculator — interactive calculation tool for operators
- Omni Calculator: ADR Calculator — worked numeric examples
- Wikipedia: Average Daily Rate — industry overview and context
- USALI (Uniform System of Accounts for the Lodging Industry) — the authoritative accounting standard for hotel metrics; consult the current edition when doing formal underwriting