

AirDNA is the better pick for studying a market and benchmarking rentals that already exist. Mashvisor is the better pick for hunting specific US listings and asking whether a house works better as an Airbnb or a long-term lease. Neither one knows what a red-rock view does to a booking calendar, and in Sedona that matters more than most spreadsheets admit.
This guide walks through how each tool gets its numbers, what each costs, where each shines, and how to use both without letting a dashboard talk anyone into a bad purchase.
TL;DR
- AirDNA is built for market research: it tracks over 10 million listings across 120,000+ markets scraped from Airbnb and Vrbo.
- Mashvisor is built for US buy-side deal hunting: it blends scraped signals with MLS and public records and compares short-term and long-term rental returns side by side.
- Entry pricing differs: AirDNA has a free tier with paid plans from roughly $34 a month billed annually, while Mashvisor Lite starts at about $49.99 a month billed annually. Check both pricing pages before buying, because plans change.
- Any projection is a starting point. In a low-density, rules-heavy market like Sedona, local comps and a human who has watched the calendar fill up matter more than the tool.
Table of Contents
- The quick verdict
- How each tool gets its numbers
- What they cost
- Where AirDNA wins
- Where Mashvisor wins
- How accurate are the estimates?
- The Sedona reality check
- A simple workflow that uses both
- Which one should you choose?
- Our perspective: the number is never the whole house
- Want a human second opinion?
- FAQ
- Sources
The quick verdict
Picture two very different houseguests. AirDNA arrives with a clipboard and a map of the whole country. Mashvisor arrives with a listing feed and a calculator, asking whether this particular kitchen can pay its own mortgage.
That is the real split. AirDNA answers a market question: which city, neighborhood or ZIP code is worth pursuing? Mashvisor answers a strategy question: for this property for sale, does a short-term rental beat a long-term lease? Analysts who compare the two tend to land in the same place: the best tool depends on where the investor is in the process, so the table below lines them up by job.
| Question | AirDNA | Mashvisor |
|---|---|---|
| Main job | Market research and benchmarking | Finding and underwriting US properties |
| Core data | Scraped Airbnb and Vrbo listings | Scraped signals plus MLS and public records |
| Long-term rental comparison | Not a focus | Core feature |
| Geography | Global | US only |
| Best moment to use it | Before choosing a market, and when benchmarking an existing rental | While actively shopping for specific homes |
How each tool gets its numbers
This is the part beginners skip, and it explains almost every disagreement between the two.
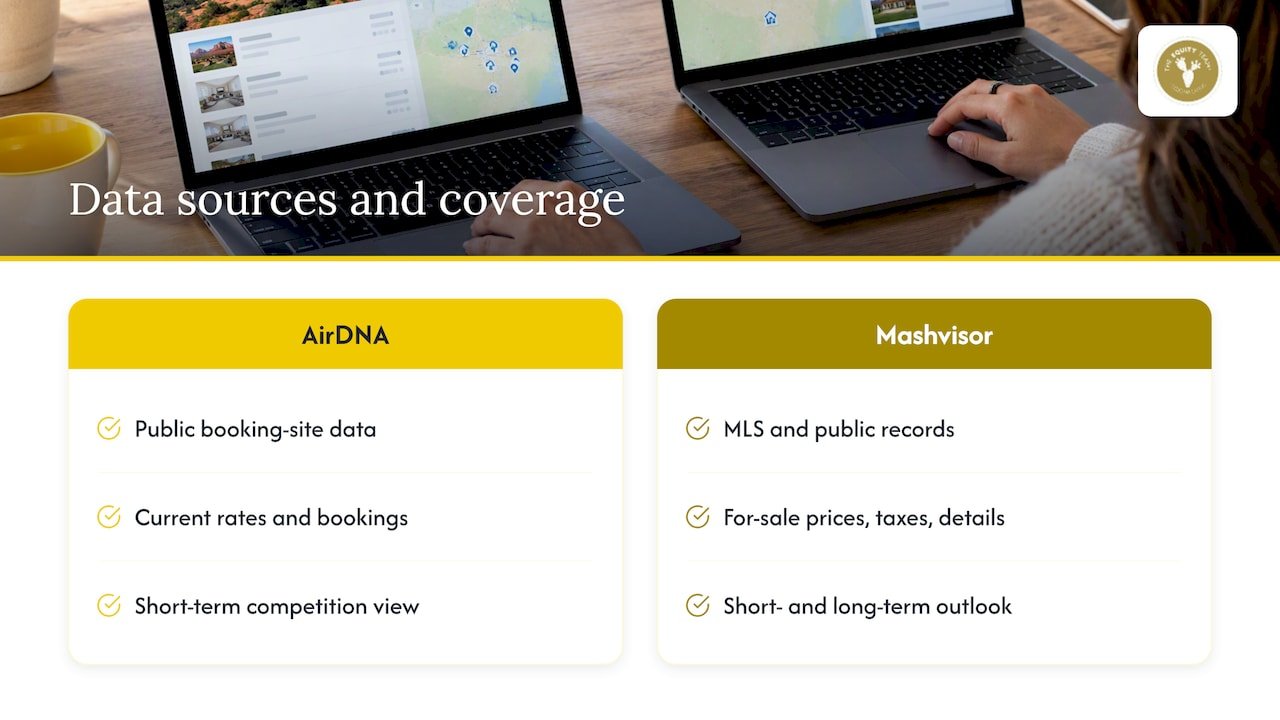
AirDNA predominantly relies on public data scraped from booking sites. Mashvisor blends those signals with MLS and public records. So AirDNA is strong on what hosts are actually charging and booking right now, while Mashvisor adds the for-sale context: list price, taxes, property details and what the same house might rent for over a year.
The consequence is simple. AirDNA captures current short-term rental competition. MLS-connected tools highlight whether a home could also work as a traditional rental. An investor who checks only one of them sees half the picture, and the gap between the two views is often where a good deal (or a hidden problem) shows up.
What they cost
Prices move, so treat these as a snapshot and confirm on each provider’s site.
- AirDNA: a free tier exists. According to a 2026 pricing roundup, the Research plan starts around $34 a month billed annually (about $400 a year), or about $125 month to month.
- Mashvisor: annual-billed plans start around $49.99 a month for Lite, $74.99 for Standard and $99.99 for Professional, per the same roundup.
You will find other numbers online. Some comparison pages quote much lower entry prices for both tools, and Mashvisor itself says its plans are substantially less expensive than AirDNA’s. Since that claim comes from the company selling the cheaper product, it is worth verifying on the live pricing pages. The practical advice: the subscription is small next to a purchase price in Sedona, so choose on fit, not on a few dollars a month.
Where AirDNA wins
Market-level research. Picking between Sedona, Cottonwood, Camp Verde or somewhere out of state is exactly the kind of wide-angle question AirDNA was designed for.
Benchmarking existing rentals. Owners who already operate a property can compare their occupancy and daily rate to a comp set, which is useful for pricing and for deciding whether to hold or sell.
Depth and history. Long market histories and large comp sets are things Mashvisor does not match.
Where Mashvisor wins
Shopping real listings. Mashvisor lets investors search for properties that are actually for sale and see whether each one looks like a profitable rental. AirDNA does not do this.
Short-term versus long-term. The side-by-side comparison is the product. For a buyer unsure whether to run guests or a yearly lease, this is a handy sanity check.
US focus. For domestic buyers who never plan to look abroad, the narrower scope is not a limitation.
How accurate are the estimates?
Accuracy claims sound impressive. Studies cited by CBRE put AirDNA’s revenue prediction at about 96.2% accurate and its supply data at 97.5%, as summarized on Mashvisor’s blog. That same page cautions that these figures are best read as directional benchmarks, and that estimates can skew optimistic by 15 to 30% depending on the property.
The reason is not mysterious. Predictive tools are algorithms, and algorithms struggle with the stuff that makes one house earn more than its neighbor: host management style, interior quality, photos, and local rules. Experienced investors treat these platforms as the start of due diligence, not the end of it.
The same goes for Mashvisor’s projections. Averages smooth out nuance, and a study of predictive revenue tools by a vacation rental operator points to exactly that weakness in tools that lean on averages.
The haircut habit
Seasoned investors rarely accept a raw revenue figure. Industry write-ups describe applying a 25% to 40% discount to raw projections to allow for owner-blocked days, management fees and vacancy in lower-density markets such as Sedona. That range is an industry habit, not a rule, and not a promise about any specific house. It is a useful reminder: a dashboard number is potential revenue, and the bank account only sees performance.
The Sedona reality check
Sedona is a funny little market. It has wildly famous scenery, a modest number of homes, and a permitting system that hosts have to take seriously. The City of Sedona requires a short-term rental permit before listing, and according to Lodgify’s summary of local rules, the annual permit fee was $210 as of January 2025, with each advertised unit needing its own permit since December 2024. Rules change, so owners should confirm with the city before relying on that.
Why does this matter for a data-tool comparison? Because a revenue estimate assumes a property can legally operate the way the comps do. No algorithm reads a permit file, an HOA rule or a zoning detail. That check is human work.
A few other Sedona wrinkles that tools tend to flatten:
- Views and location. Two homes on the same street can earn very different amounts depending on what is visible from the deck.
- Neighboring towns. Oak Creek, Cottonwood, Cornville and Camp Verde each behave differently from Sedona proper. Our own market write-ups show the spread: see Oak Creek’s median revenue and what AirDNA misses, the Camp Verde revenue range, and the Cottonwood comp assumptions.
- Seasonality. Spring and fall hum, while the shoulder months get quiet. Annual averages hide that rhythm.
- Appraisals. Strong rental income does not automatically lift a lender’s appraised value, a point covered in why Sedona Airbnb revenue rarely raises appraised value.
A simple workflow that uses both
Plenty of careful investors do not pick a winner. They use each tool for the job it is good at.
- Pick the market with AirDNA-style data. Compare occupancy, daily rate and supply trends across candidate towns.
- Build a shortlist in a deal-finder. Use a Mashvisor-style search to see actual for-sale homes and their short-term versus long-term projections.
- Apply a haircut. Discount the raw revenue figure for management, blocked days and slow months.
- Check the rules. Confirm permit status, HOA limits and tax licensing for the specific address.
- Pull local comps. Ask someone who tracks real Sedona-area bookings to compare the estimate with what similar homes actually earned.
- Stress-test the exit. Ask what the property is worth to the next buyer if rental income softens.
For the bigger picture on step one, our guide on how to find the right short-term rental investment walks through the criteria in more detail, and Arizona Airbnb occupancy data shows how to turn raw percentages into underwriting assumptions.
Which one should you choose?
A short, honest cheat sheet:
- Choose AirDNA if the question is which market, what rates, or how an existing rental stacks up against its competition.
- Choose Mashvisor if the question is which specific US listing to chase, or whether to rent short or long.
- Use both for a first purchase in an unfamiliar area. The overlap is cheap insurance.
- Skip both for the final decision. The final number should come from comps, permits and a local expert.
What about the other names that pop up when readers look for AirDNA alternatives? Most fall into a few types: lighter calculators that produce a high, medium and low revenue scenario for lenders, spreadsheet templates, and management-software dashboards. They can be handy as a second opinion. None of them replaces knowing the street.
Our perspective: the number is never the whole house
We work with Sedona short-term rental buyers and sellers every day, and we have watched plenty of clients arrive with a screenshot from one tool or another. Our take is friendly but firm.
The screenshot is a fine conversation starter. It is a terrible closing argument. A projection treats a home as a bundle of bedrooms, baths and a ZIP code. A Sedona guest treats it as a place to watch the sunset from a hot tub. Those are different things, and only one of them shows up in the reviews.

So we use tools the way a good cook uses a recipe: as a guide, tasting as we go. We compare estimates against local performance, we sanity-check permits and rules, and we think about the exit before the offer, because a rental that cannot resell well is a riskier rental. Our Sedona Airbnb valuation guide and resale benchmarks explain how we think about that.
If we had to give one rule: let the software narrow the field, and let local comps make the call.
— Chad
Want a human second opinion?
The Equity Team is a Sedona real estate team that specializes in short-term rental investment. Buyers can bring a shortlist and a pile of dashboard screenshots to our buyer representation, and owners thinking about selling can request a Sedona vacation rental CMA that compares their home to what comparable rentals really achieved. Not sure whether to keep or sell? The rental exit strategy conversation is a low-pressure place to start.
FAQ
Is Mashvisor or AirDNA more accurate?
Neither is accurate enough to be the only input. AirDNA’s revenue accuracy is often cited near 96%, but that figure is a benchmark, and individual properties can come in well below an optimistic estimate. Mashvisor adds MLS context, which helps on the buy side, but it faces the same property-specific limits. Cross-check both against local comps.
Is AirDNA or Mashvisor cheaper?
It depends on the plan. One 2026 roundup lists AirDNA’s Research plan from about $34 a month billed annually and Mashvisor Lite from about $49.99 a month billed annually, but other sites quote different figures. Confirm on each provider’s pricing page before subscribing.
Can these tools tell me if a Sedona home can legally be a short-term rental?
No. They estimate income, not legality. Permit status, HOA rules and tax licensing have to be checked with the City of Sedona and the property’s own documents. A Sedona real estate agent who works with rentals can help make sure those checks happen before an offer.
What are the alternatives to AirDNA?
Alternatives come in a few types: other market-data platforms, revenue-scenario calculators built for lenders, MLS-connected deal finders like Mashvisor, and free spreadsheet templates. Which one fits depends on whether the job is market research, deal screening or lender paperwork.
Sources
- AirDNA vs Mashvisor 2026: Honest Comparison for Hosts, 10xbnb
- AirDNA Alternatives 2026: Which Are Free, What Each Costs, MagicBNB
- How Accurate Is AirDNA? A Complete Review, Mashvisor
- AirDNA vs Mashvisor: Data Platform or Deal Finder? VaultSTR
- Are Predictive Short Term Rental Revenue Tools Accurate? Haus Vacation Rentals
- Sedona Short-Term Rental Regulations, Lodgify