

Arizona short-term rentals run roughly mid-50s percent occupancy statewide, but that single number hides a canyon-sized gap between markets. Sedona and Scottsdale post occupancy in the high 50s and 60s with premium daily rates, while gateway towns like Page can dip into the mid-20s during slow stretches. The real investor lesson isn’t the state average. It’s that occupancy times rate, not occupancy alone, is what should drive any offer you write.
TL;DR:
- Occupancy rates vary significantly between cities, with Scottsdale at 66% and Page as low as 25%, affecting potential revenue.
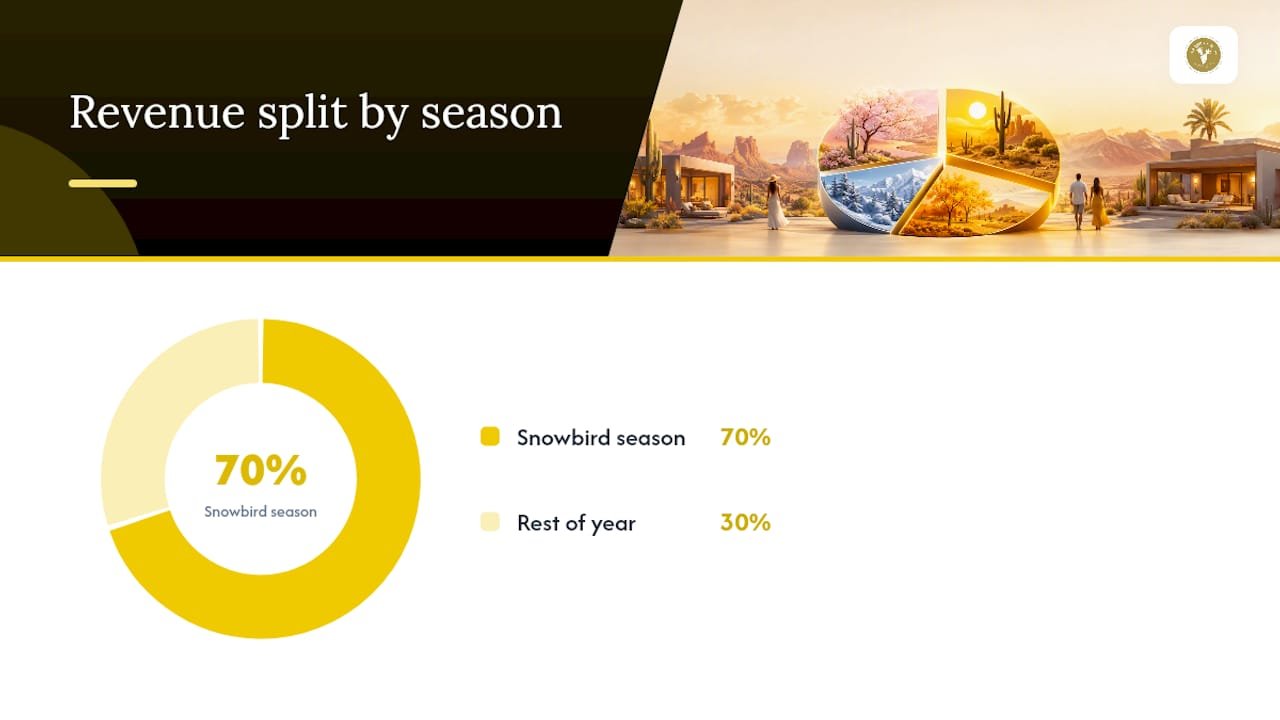
- Market demand for short-term rentals is highly seasonal, with 70% of revenue generated during the snowbird season from October to April.
- Revenue projections should focus on RevPAR, which combines occupancy and ADR, rather than occupancy alone, for accurate valuation.
- Property-level analysis, considering local zoning, amenities, and seasonality, is essential before making investment decisions.
- Diversify data sources and verify current regulations, as Arizona’s short-term rental laws and demand patterns are subject to change.
Table of Contents
- What Arizona Airbnb Occupancy Actually Means for Your Underwriting
- City Highlights: How Occupancy Varies From Phoenix to Page
- Seasonality and Pricing Strategy: Working With, Not Against, the Snowbird Calendar
- Turning Occupancy Into a Revenue and Valuation Model
- How the Major Data Providers Measure Arizona’s Market
- Local Evidence From The Equity Team: What Sedona Signals Actually Say
- Arizona’s Short-Term Rental Regulatory Climate
- How Local Events and Tourism Trends Move Occupancy
- What COVID-19 Taught Arizona’s Short-Term Rental Market
- Improving Occupancy Beyond Pricing Adjustments
- Chad’s Take: Where the Real Opportunity Sits in Arizona Right Now
- How Equity Team Helps You Underwrite the Right Arizona Property
- Sources
What Arizona Airbnb Occupancy Actually Means for Your Underwriting
Occupancy is the percentage of available nights a listing gets booked over a set window, usually the trailing 12 months. It’s the first number everyone quotes and the most misunderstood one in the room, because a property with lower occupancy can easily out-earn a fully booked one if its nightly rate is high enough.
Statewide, aggregator data puts Arizona occupancy in the mid-50s percent, with GuestFavorites reporting average annual revenue near $53,258 per listing across an Arizona sample taken earlier in 2026. Other providers land closer to $44,000 to $53,000 depending on the sample and time window, which is exactly why triangulating sources matters before you trust a single headline figure.
Here’s the quick statewide picture investors should keep in their back pocket:
- Occupancy: mid-50s percent statewide average, translating to roughly 200 booked nights a year for a typical listing
- Average daily rate (ADR): varies wildly by market, from $164 in Tucson to $334 in Sedona
- Annual revenue: roughly $44,000 to $53,000 statewide average, with resort towns running two to three times higher
- Supply: thousands of active listings statewide, with Sedona alone carrying over 3,500 tracked listings and metro markets like Phoenix and Tucson each running in the low thousands
For underwriting purposes, treat the statewide number as a sanity check, not a target. A Phoenix condo and a Sedona casita with red-rock views are not competing in the same demand pool, and pricing them off the same occupancy assumption will get your revenue projection wrong in either direction.
City Highlights: How Occupancy Varies From Phoenix to Page
Arizona’s Airbnb market splits into distinct personalities once you get past the statewide average. Each city has its own occupancy ceiling, rate structure, and seasonal rhythm, and mixing them up in a pro forma is one of the fastest ways to overpay for a property.
- Phoenix: roughly 61% occupancy with an ADR around $172 across about 391 active listings, generating annual revenue near $34,200 per property. Demand concentrates hard during snowbird season, which is the defining feature of the metro market.
- Sedona: about 57% occupancy but a much richer ADR near $334, pushing average annual revenue to roughly $62,600 per listing across more than 3,500 active properties. Lower occupancy here isn’t a warning sign. It’s the tradeoff for premium positioning in a market where guests pay for scenery, not just square footage.
- Scottsdale: the occupancy leader among major markets at roughly 66%, paired with strong RevPAR near $238. Resort infrastructure, golf tourism, and a steady luxury clientele keep booking calendars fuller than almost anywhere else in the state.
- Tucson: sits close to the state average at around 60% occupancy with an ADR near $164 and annual revenue around $31,400 per listing across roughly 3,757 active listings. Tucson’s demand comes from university traffic, winter visitors, and regional business travel rather than a single tourism draw, which makes it steadier but less spectacular than the resort towns.
- Page: a case study in seasonality risk, with occupancy examples running around 25%. Page’s gateway-town economics depend almost entirely on Lake Powell and Horseshoe Bend tourism, so a slow shoulder season can crater annual numbers even when peak-season ADR looks attractive.
The pattern across every city is the same: occupancy and rate move in opposite directions more often than not. Scottsdale wins on volume, Sedona wins on price, and Page reminds you what happens when a market has almost no demand diversification to fall back on.
Seasonality and Pricing Strategy: Working With, Not Against, the Snowbird Calendar
Arizona’s short-term rental calendar has one dominant rhythm: snowbirds arrive in October and mostly clear out by April, and that six-month window carries an outsized share of annual revenue. Calibr8ted’s Phoenix market analysis describes a rough 70/30 split, where about 70% of annual revenue gets generated in the roughly 40% of the year that counts as snowbird season.
That split explains why static, year-round pricing is such an expensive mistake. Industry analysis of Phoenix revenue patterns suggests flat pricing can leave 15% to 25% of potential annual revenue on the table compared to a seasonally adjusted strategy, because it either underprices peak demand or overprices a dead summer market.
Three tactics fix most of that gap:
- Raise rates aggressively from October through April, then discount just enough in the shoulder months to keep the calendar from going empty.
- Push monthly or 30+ day stays during snowbird season instead of chasing nightly turnover. Long-stay guests cut cleaning costs and platform fees while pushing effective occupancy toward 100% for the length of their stay.
- Target relocation and travel-nurse demand for summer mid-term stays, pricing 20% to 30% below your peak monthly rate to secure occupancy while the nightly market is soft.
Pro Tip: Run your calendar backward from April. Lock in your highest-value snowbird bookings first, then fill shoulder months with medium-length stays before you ever discount down to nightly summer rates.
Owners who lean into monthly bookings during peak season, rather than fighting for nightly turnover, consistently protect net revenue better than those chasing top nightly rates.
Turning Occupancy Into a Revenue and Valuation Model
Occupancy only matters to the extent it feeds into RevPAR, revenue per available rental, which is the metric that actually drives what a property is worth. The formula is simple: RevPAR equals occupancy multiplied by ADR, and annual revenue equals RevPAR multiplied by 365 available nights.
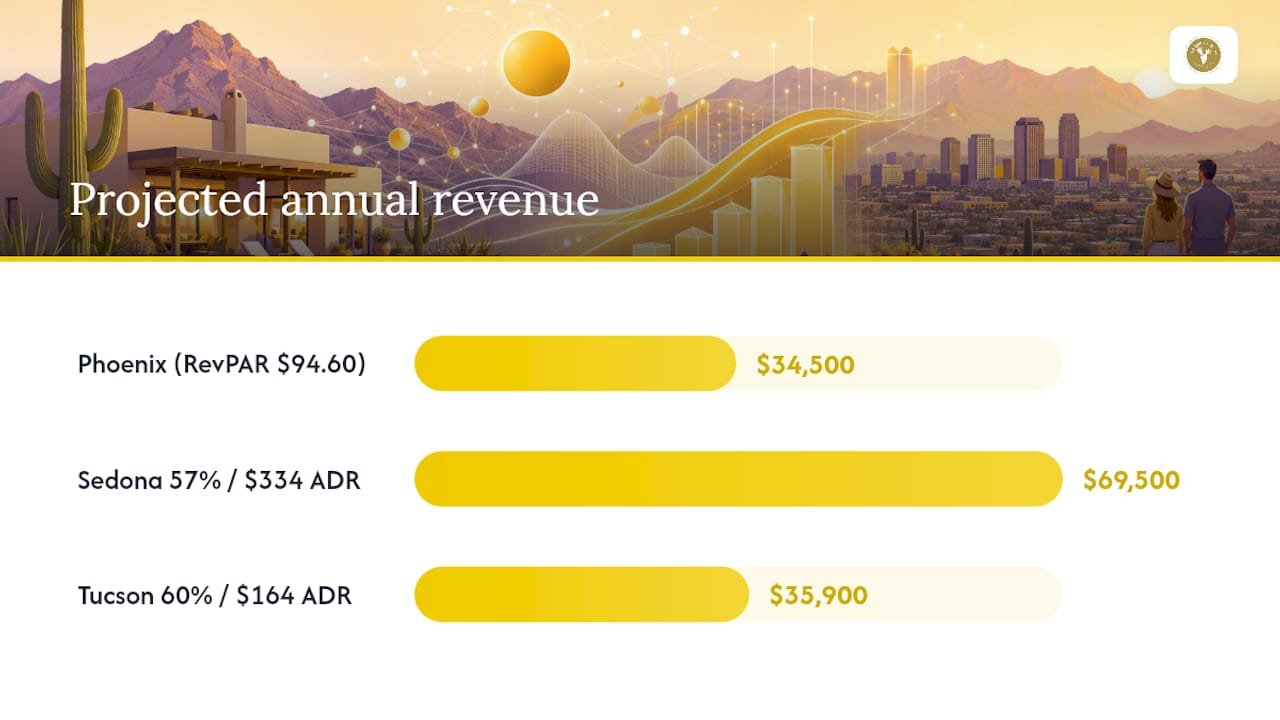
RevPAR comes out to about $94.60 per available night. Multiply that by 365 and you land near $34,500 in projected annual revenue, which tracks closely with the actual Phoenix averages reported for the trailing 12 months.
That same math is what separates a good deal from a mediocre one when you’re comparing two listings with different occupancy and rate profiles:
- A Sedona property at 57% occupancy and $334 ADR clears roughly $69,500 in RevPAR-driven annual revenue before adjustments
- A Tucson property at 60% occupancy and $164 ADR clears roughly $35,900
- Occupancy alone would suggest Tucson is the stronger performer; RevPAR shows Sedona wins by a wide margin
Sustained occupancy trends matter more to valuation than a single strong year. Lenders and buyers underwriting cap rates want two to three years of stable or rising occupancy, not a single peak season that happened to catch a good calendar. If occupancy has been sliding for consecutive trailing-12-month periods, that’s a signal to stress-test your payback period, not to write a full-price offer.
How the Major Data Providers Measure Arizona’s Market
Occupancy, ADR, and RevPAR sound standardized, but every provider builds its trailing-12-month sample a little differently, and that’s why two sources can show the same city with meaningfully different numbers.
- AirDNA pulls listing-level calendar data across major platforms and reports occupancy, ADR, and revenue by city and by property type, which is why its Phoenix, Sedona, Scottsdale, and Tucson breakdowns are widely cited by lenders.
- Airbtics focuses on neighborhood-level performance estimates, useful for narrowing in on a specific submarket rather than a whole metro.
- Rabbu publishes market snapshots with an ROI-style scoring system, which is where the Page, Arizona seasonality data comes from.
- GuestFavorites aggregates broader statewide averages, which is why its Arizona figures sometimes land a few points off from single-city AirDNA numbers.
Sample size, private-booking blind spots, and short measurement windows can all skew a single provider’s snapshot. The practical rule: pull two or three sources for any market you’re serious about, then confirm with a property-level calendar check before you finalize an offer.
Local Evidence From The Equity Team: What Sedona Signals Actually Say
Equity Team’s own tracking has flagged a 24% drop in Sedona short-term rental supply, a shift that’s tightening competition for well-positioned listings. Nearby Camp Verde properties in our data have posted annual revenue in the $14,500 to $16,300 range, a useful comparison point for buyers weighing Sedona proper against its lower-cost neighbors.
Before bidding on any Northern Arizona STR, check seasonality exposure, HOA and zoning restrictions, and amenity premiums like a pool or hot tub, which consistently move ADR in Sedona’s market. Guest profile matters too: a property built for couples’ getaways underperforms if it’s marketed to large groups. Reach out for a Sedona comparative market analysis if you want property-level numbers behind these citywide trends.
Arizona’s Short-Term Rental Regulatory Climate
Arizona regulates short-term rentals primarily at the state level, with cities layered on top through licensing, tax collection, and nuisance-abatement rules rather than outright bans. Owners generally need a transaction privilege tax license and must collect applicable state and local lodging taxes, and several municipalities have added registration requirements or caps on certain rental types in response to neighborhood complaints.
Sedona and the surrounding Verde Valley have seen tightening local rules that contributed to the supply pullback Equity Team has tracked, and HOA restrictions in many Sedona-area communities add another layer that state law alone doesn’t cover. Scottsdale and Phoenix have their own local ordinances around noise, parking, and permitted zoning that can affect which properties are even eligible to operate as STRs.
None of this makes Arizona an unfriendly STR state compared to markets with outright rental bans, but the rules aren’t static. A property that’s fully compliant today could face a new local ordinance within a year or two, so any serious buyer should verify current zoning and licensing status for the specific parcel, not just the city, before closing. Check with the specific municipality and, where applicable, the property’s HOA before assuming a listing can legally operate.
How Local Events and Tourism Trends Move Occupancy
Arizona’s occupancy swings track tourism calendars almost as tightly as they track weather. Scottsdale sees a reliable bump around major golf tournaments and spring training season, when hotel overflow pushes bookings and rates into nearby short-term rentals. Sedona’s occupancy tends to hold steadier year-round than Phoenix’s because red-rock tourism, hiking, and wellness travel don’t depend on a single event or season the way snowbird migration does.
Page’s occupancy is almost entirely a function of Lake Powell recreation season, which is why its numbers swing harder than any other Arizona market covered here. Tucson benefits from a similar but smaller dynamic around the Gem and Mineral Show each winter, which fills listings that would otherwise sit closer to the summer average.
The takeaway for investors is to map your target property’s occupancy calendar against its local event calendar before assuming a trend will hold. A strong occupancy month tied to a one-time event or festival isn’t the same signal as steady, broad-based tourism demand, and pro formas that don’t separate the two tend to overstate what a property will do in a normal year.
What COVID-19 Taught Arizona’s Short-Term Rental Market
The pandemic reshaped Arizona’s short-term rental demand in ways that are still visible in the data. Drive-to destinations like Sedona and Scottsdale saw demand recover faster than urban markets, because travelers wanted open space and privacy rather than downtown hotel towers. That shift helped entrench the premium positioning Sedona still holds today.
Remote work also extended the snowbird season for some markets, since visitors no longer had to fly home for a return-to-office date. That contributed to the rise in mid-term and monthly bookings that now shape pricing strategy across Phoenix and Tucson. Supply chain disruptions and rising renovation costs in the years following the pandemic also slowed new listing growth in some Arizona markets, which helped keep occupancy from softening as fast as it might have with unchecked new supply.
The bigger lesson for investors underwriting a 2026 purchase is that external shocks, whether a pandemic, a wildfire season, or a spike in gas prices affecting drive-to tourism, hit Arizona’s STR markets unevenly. Diversify your assumptions accordingly, and don’t build a pro forma that only survives if every year looks like a normal year.
Improving Occupancy Beyond Pricing Adjustments
Rate strategy gets most of the attention, but marketing and guest experience improvements move occupancy just as reliably, especially once your pricing is already dialed in.
Professional photography and a listing description that leads with what makes the property distinct, a Sedona view, a Scottsdale pool, a Tucson casita’s privacy, consistently outperforms generic listings competing on price alone. Fast response times and a smooth check-in process also feed directly into a platform’s search ranking, which means better operational habits translate into more bookings without touching your nightly rate.
Guest experience upgrades pay off in occupancy through repeat bookings and reviews rather than through any single lever. A thorough turnover cleaning process protects your review score, and a strong review score is one of the few factors that compounds over time. Small amenity additions, better coffee, a stocked pantry basics kit, local guidebooks, tend to shift a listing from “good enough” to “book again,” which matters more in a market with thousands of competing Arizona listings than most owners assume.
Chad’s Take: Where the Real Opportunity Sits in Arizona Right Now
The mid-tier is getting squeezed. Phoenix’s snowbird dependency and Page’s seasonality risk make those markets harder to underwrite confidently, while Sedona and Scottsdale keep proving that premium positioning survives lower occupancy just fine. If I were bidding in 2026, I’d rather own a property with strong ADR and defensible seasonal demand than one chasing occupancy alone. Run a property-level comparative market analysis before you bid on anything. The statewide averages will get you in the ballpark; they won’t tell you if the specific house is worth what someone’s asking.
— Chad
How Equity Team Helps You Underwrite the Right Arizona Property
This local real estate team offers an alternative to guessing your way through Arizona occupancy data with comparative analyses that go beyond city averages into seasonality, zoning, and amenity factors that influence whether a Sedona property hits its revenue target.

If you’re weighing a purchase against the numbers covered here, whether that’s a Sedona casita competing on ADR or a Camp Verde property competing on price, we can build a property-level comparative market analysis that pressure-tests occupancy assumptions before you write an offer. Our clients operate in the top 10% of the rental market for a reason: they underwrite with real local data, not statewide averages. Request a Sedona short-term rental comparative market analysis and get numbers specific to the property you’re actually considering, or reach out to talk through what it takes to find the right STR investment in today’s market.
Sources
- Sedona, Arizona short-term rental market data (2026)
- Scottsdale, Arizona short-term rental occupancy & seasonality (2026)
- Arizona Airbnb occupancy rates (August 2026) — GuestFavorites
- Phoenix STR market report: snowbird season & pricing (Calibr8ted)