

What the 2026 Sedona STR data actually tells you
Sedona’s short-term rental market is a bit like the red rocks themselves: stunning on the surface, but the real story is in the layers underneath. The headline occupancy number sits around a modest range, while the average daily rate has climbed to a high level and trailing 12-month revenue per listing reflects a strong market performance. That is not a struggling market. That is a market that grew up.
The supply side explains most of the occupancy shift. Active listings expanded significantly over the period, which naturally spread demand across more doors. Occupancy dropped notably over that period, but ADR rose enough to soften the revenue impact considerably. The market did not collapse. It matured.
For investors doing a Sedona STR occupancy data analysis, the single most important insight is this: the average number is almost irrelevant. What matters is which tier you are in.

| Metric | Value |
|---|---|
| Market-wide occupancy in 2026 is estimated to be modestly below peak levels. | |
| Average daily rate (ADR) is elevated, reflecting strong pricing. | |
| Trailing 12-month revenue per listing remains strong. | |
| The market has seen a substantial number of active STR listings. | |
| Occupancy has declined since 2021 to a more normalized level. | |
| Supply growth over the period has been considerable. | |
| Bottom quartile listings earn significantly less monthly revenue than top-tier listings. | |
| Median monthly revenue positions properties in the middle range. | |
| Top quartile listings generate higher monthly revenue due to location and quality. | |
| Top 10% listings capture a substantially disproportionate share of total market revenue. |
A few things worth pulling out quickly:
- The gap between the bottom 25% and top 10% is not a rounding error. It is a $9,854 monthly difference.
- Premium locations like the Chapel area push ADR to $427, while luxury view homes exceed $400 even in shoulder months.
- Annual revenue per listing averages about $83,895 across the market for active listings in early 2026, with significant variation by location and tier; top-performing properties earn substantially more.
- Sedona draws 3.2 million visitors annually, generating $1 billion in tourism revenue for the local economy.
The occupancy decline is real, but it is a supply story, not a demand story. Demand keeps growing. The competition for that demand just got stiffer.
Table of Contents
- How Sedona STR metrics break down by trend, location, and data source
- What actually drives revenue in Sedona’s STR market
- Sedona’s seasonal patterns and when the money actually flows
- Ready to find your spot in Sedona’s top tier?
- Key Takeaways
How Sedona STR metrics break down by trend, location, and data source
Year-over-year trends from 2021 through 2026

The pandemic travel boom was genuinely wild for Sedona. Occupancy hit 68% in 2021 when supply was thin and pent-up demand was enormous. As new listings flooded in, occupancy normalized. By 2025 it had settled near 53%, and early 2026 data shows it holding in the 49%–52% range depending on the source and methodology. ADR, meanwhile, kept climbing. That combination, lower occupancy but higher nightly rates, is the defining characteristic of Sedona’s current market phase.
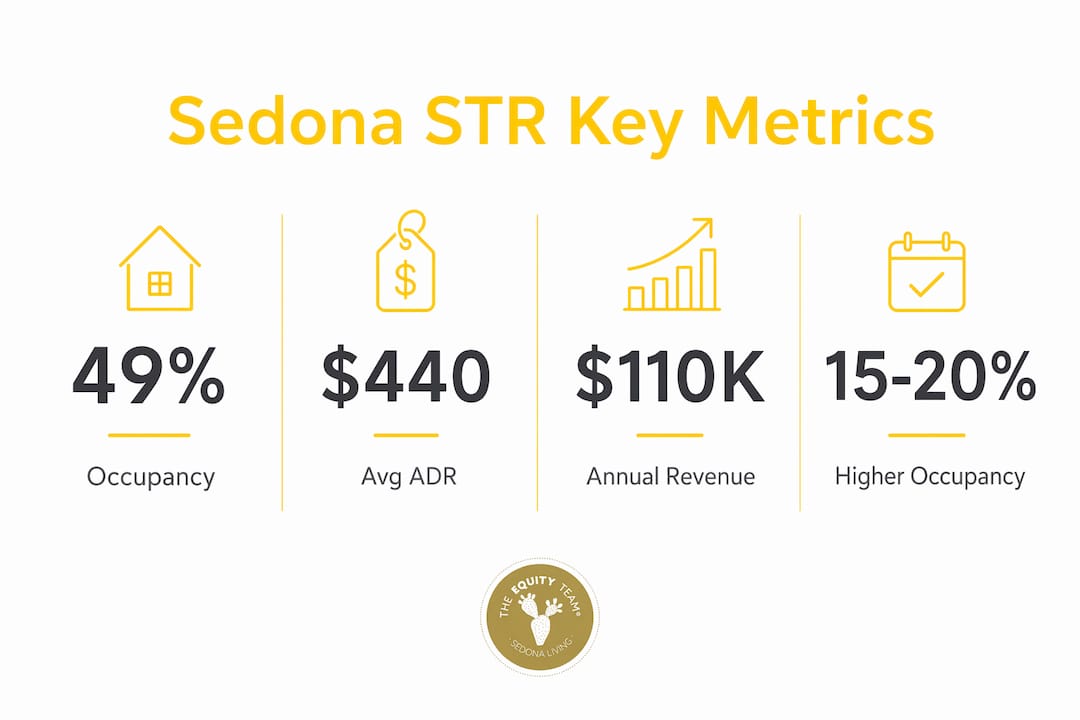
Market-wide occupancy in 2026 is typically reported around 49%, with ADR at $440 and trailing 12-month revenue per listing at $83,895, based on StaySTRA’s aggregated listing data for early 2026. Differing sample methodologies may yield higher occupancy figures, but the most current comprehensive data supports the 49% level. The variance between sources is worth understanding: AirDNA, Rabbu, and AirROI each pull from different data sets, use different smoothing methods, and may include or exclude certain listing types. When you are evaluating a specific property, cross-referencing at least two platforms gives you a more honest picture than relying on any single number.
Segmentation by property type and neighborhood
Not all Sedona zip codes are created equal, and the data makes that clear. The Chapel area, with its dramatic views and proximity to one of Sedona’s most photographed landmarks, commands ADRs around $427. Luxury view homes push above $400 even outside peak months. Smaller condos and entry-level listings in less scenic corridors compete almost entirely on price, which is a tough game when the market has 1,805 active listings.
Large luxury properties with premium amenities maintain occupancy rates 15%–20% higher than smaller condos regardless of where the market-wide seasonality sits. That gap does not close in slow months. It actually widens, because budget travelers disappear first when demand softens, while guests willing to pay $500+ a night for a red rock view keep booking.
Pro Tip: When comparing Sedona neighborhoods for investment, look at ADR consistency across seasons, not just peak-month revenue. A property that holds $400+ ADR in August is a fundamentally different asset than one that needs to drop to $180 to stay competitive.
How Sedona compares to nearby Arizona markets
Sedona holds up well against its Arizona neighbors, particularly in the summer months when most people assume the desert empties out. Sedona’s elevation moderates summer heat enough that August occupancy stays around 39% while ADR holds near $357. Scottsdale and Phoenix see sharper summer drops, with ADRs falling into the $306–$326 range during the same period. That relative resilience matters for annual revenue calculations and DSCR modeling.
Scottsdale skews toward corporate and event-driven demand. Sedona is almost purely leisure and experiential travel, which means its demand drivers are different and, for the right property, more durable. Visitors come for the red rocks, the vortexes, the hiking, and the weddings. Those motivations do not evaporate when the economy gets bumpy the way corporate travel budgets do.
Data sources and what they actually measure
| Platform | Primary Data Method | Best Used For |
|---|---|---|
| AirDNA | Scraped listing data + booking estimates | Market-wide trend analysis |
| Rabbu | Aggregated STR performance data | Revenue benchmarking by market |
| AirROI | Comparative ROI modeling | Investment return projections |
| CoStar | Hotel and lodging transaction data | Broader lodging market context |
Each platform has its own methodology quirks. AirDNA’s occupancy figures tend to reflect booked nights as a share of available nights, which can differ from how a property manager calculates occupancy on their own books. Rabbu weights its averages differently. Neither is wrong. They are measuring slightly different things. Savvy investors use them as directional signals, then validate with actual booking history from comparable properties before making a purchase decision.
The Sedona Tourism Transparency Hub also publishes visitor data that can help contextualize demand trends independent of any STR platform’s methodology.
Regulatory environment shaping supply
Sedona currently operates under Arizona state preemption, which means the city cannot impose permit caps the way some California or Colorado municipalities have. That has allowed supply to grow freely, which is exactly why listings jumped 62% in five years. However, pending state legislation (HB 2429) could introduce occupancy limits and distance requirements, which would meaningfully constrain future supply growth.
The city’s own code already has some nuance worth knowing. Accessory dwelling units issued a certificate of occupancy on or after September 14, 2024, cannot be used as short-term rentals unless the property owner’s primary residence is the main structure on the same lot. That rule, embedded in Sedona City Code 5.25.050, catches some buyers off guard. Every STR also requires a valid Arizona transaction privilege tax license before it can be rented or offered for rent.
If HB 2429 passes in a meaningful form, the supply growth that drove occupancy down could slow or reverse, which would be a tailwind for existing operators. Investors buying now would benefit from that shift. It is not guaranteed, but it is worth watching closely.
What actually drives revenue in Sedona’s STR market
The 80/20 reality
Here is the uncomfortable truth about Sedona short-term rental performance: roughly 20% of listings capture a disproportionate share of total market revenue, while the other 80% compete primarily on price with limited success. The top tier has premium views, pools, professional management, and dynamic pricing. The bottom tier has none of those things and wonders why occupancy is soft.
This is not a Sedona-specific phenomenon, but it is particularly pronounced here because the guest profile skews toward experience-seekers willing to pay for quality. Someone flying in from Chicago for a Sedona wellness retreat is not cross-shopping a $150/night condo against a $500/night view home. They are different buyers entirely.
The revenue gap between tiers is not subtle. Top 10% listings average $12,174 per month. The bottom 25% average $2,320. That is a 5x difference driven almost entirely by property quality, location, and management execution.
Professional management and dynamic pricing
Top-managed luxury five-bedroom properties with pools can generate $220,000–$300,000 annually. An average one-bedroom with weak management might clear $28,000. The difference is not just the property. It is the pricing strategy, the listing quality, the review velocity, and the responsiveness to demand signals.
Dynamic pricing tools like PriceLabs or Wheelhouse adjust nightly rates in real time based on local demand, competitor availability, and booking pace. Properties using these tools consistently outperform static-priced listings, particularly during event weekends when rates can spike 2–4x baseline. Leaving that revenue on the table by setting a flat rate is one of the more avoidable mistakes in this market.
For investors evaluating a property’s income potential, rental income evaluation should always include a management cost analysis. A property earning $120,000 gross with a 30% management fee nets very differently than one earning $95,000 with an owner-operated setup.
Premium amenities that move the needle
Pools and hot tubs are not just nice-to-haves in Sedona. They are revenue multipliers, especially during the summer trough when guests need a reason to book despite the heat. Outdoor spaces with red rock views command premium ADRs year-round. Properties with these features hold their rates when the market softens; properties without them discount aggressively to compete.
The hot tub effect on Sedona STR revenue is well-documented among local operators. A property that adds a hot tub and a deck with a view is not just adding an amenity. It is moving into a different competitive tier.
Financing and DSCR considerations
Debt service coverage ratio lending is the most common financing path for STR investors, and Sedona’s revenue profile generally supports it, but not universally. Most DSCR lenders want to see a ratio of 1.25 or higher, meaning the property’s projected rental income needs to cover 125% of the mortgage payment. At median revenue of roughly $4,571 per month, a property with a $3,000 monthly mortgage clears that threshold. A property with a $4,500 monthly mortgage does not.
The practical implication: investors targeting the median market tier need to be thoughtful about purchase price and financing structure. Investors targeting the top 25% have more room to work with, but they are also paying more for the property. Running the numbers carefully before making an offer is not optional. Equity Team works exclusively with investors and runs this analysis as a standard part of the acquisition process.
Sedona’s seasonal patterns and when the money actually flows
Sedona’s dual-peak structure is one of the things that makes it genuinely interesting compared to single-season markets. Most Arizona resort destinations have one good season and one rough one. Sedona has two good ones, a manageable middle, and a summer trough that is not nearly as bad as the elevation-challenged markets to the south.
Spring: the big one
March and April are Sedona’s strongest months. Spring peak occupancy hits around 72%, driven by ideal hiking weather, blooming desert flora, and the general human desire to escape winter. ADRs climb accordingly. This is when the red rocks are at their most photogenic, the trails are packed, and every decent property in town is booked weeks in advance. Investors who own well-positioned properties in spring can generate a meaningful portion of their annual revenue in just eight weeks.
Fall: the underrated season
October and November bring occupancy back up to around 61%, fueled by cooler temperatures, fall foliage in the surrounding Oak Creek Canyon, and a heavy wedding season. Sedona is one of the most popular wedding destinations in the Southwest, and that event-driven demand creates reliable booking clusters. ADR peaks at $471 in October, making it one of the highest-rate months of the year despite lower occupancy than spring.
The fall season also benefits from a different guest mix. Spring draws the outdoor adventure crowd. Fall brings couples, wedding parties, and the wellness retreat crowd. Properties that cater to multiple guest types, think a four-bedroom with a hot tub and a view, perform well across both peaks.
Summer: not as scary as it looks
Summer occupancy drops to 39%–41%, which sounds rough until you compare it to Phoenix and Scottsdale. Sedona sits at roughly 4,500 feet of elevation, which keeps summer highs in the 90s rather than the 110s. That relative comfort supports summer bookings from families on school-break schedules and guests who want a cooler Arizona experience. August ADR holds near $357, well above what comparable properties in lower-elevation markets can command.
The summer trough is real, but it is manageable. Properties with pools and outdoor amenities see the smallest summer drops. Properties without them feel it most.
December: the holiday spike
December is quirky in the best way. ADR peaks at $506, the highest of any month, driven by holiday travelers, Christmas week bookings, and New Year’s Eve demand. Occupancy does not match spring levels, but the nightly rate more than compensates. Event-driven price surges on peak holiday weekends can run 2–4x baseline rates.
Seasonal pricing strategy matters enormously here. A property that does not adjust rates for December is leaving real money on the table. The 2026 pricing guide for active Sedona bookings covers the mechanics of capturing these spikes without pricing out the shoulder-week bookings that fill the gaps.
- March–April: ~72% occupancy, strong ADR, highest annual revenue concentration
- October–November: ~61% occupancy, $471 ADR in October, wedding and wellness demand
- December: Highest ADR at $506, holiday spike with 2–4x rate surges on peak weekends
- Summer (June–August): 39%–41% occupancy, $357 ADR in August, pool properties outperform
- January–February: Shoulder season, moderate demand, good for maintenance and capital improvements
For investors thinking about peak rental season timing, the dual-peak structure means Sedona’s revenue is more evenly distributed across the year than most single-season markets. That makes annual cash flow projections more predictable and DSCR modeling more reliable.
Ready to find your spot in Sedona’s top tier?

Equity Team is the first STR-specialized real estate group in Northern Arizona, and the clients we represent operate in the top 10% of the Sedona rental market. That is not a coincidence. It is the result of working exclusively with investors, running real data on every property, and knowing which listings are positioned to outperform before the first guest ever books.
Whether you are buying your first Sedona STR or adding to an existing portfolio, finding the right investment property starts with understanding the data. Equity Team makes that process a lot less mysterious and a lot more profitable.
Key Takeaways
Sedona’s STR market rewards investors who buy into the top performance tier, where ADR strength and premium amenities offset market-wide occupancy normalization.
| Point | Details |
|---|---|
| Occupancy has normalized, not collapsed | Market-wide occupancy sits at 49% in early 2026 due to 62% supply growth, not weakening demand. |
| ADR growth offsets occupancy decline | ADR rose significantly between 2021 and 2026, sustaining strong per-listing revenue. |
| Tier gap is the defining metric | Top 10% listings average $12,174/month versus $2,320 for the bottom 25%. |
| Dual-peak seasonality supports cash flow | Spring (72% occupancy) and fall (61%) create two revenue peaks, with December ADR hitting $506. |
| Premium amenities change the tier | Pools, views, and professional management keep occupancy 15%–20% above smaller condos year-round. |