

Sedona rental income potential is defined by three numbers every investor needs before making an offer: average daily rate (ADR), occupancy, and Revenue Per Available Room (RevPAR). The short-term rental market here runs on a dual-peak seasonal calendar, with spring and fall delivering the strongest returns, while summer quietly humbles anyone who overestimated year-round demand. Sedona’s red rock backdrop draws guests willing to pay premium rates, but the math only works when you account for operating expenses, financing constraints, and the wide performance gap between average listings and top performers. This guide walks you through the full picture.
What key metrics determine Sedona rental income potential?
Revenue Per Available Room is the single best metric to assess Sedona STR income potential. It combines ADR and occupancy into one number, so you can compare properties fairly regardless of size or price point.
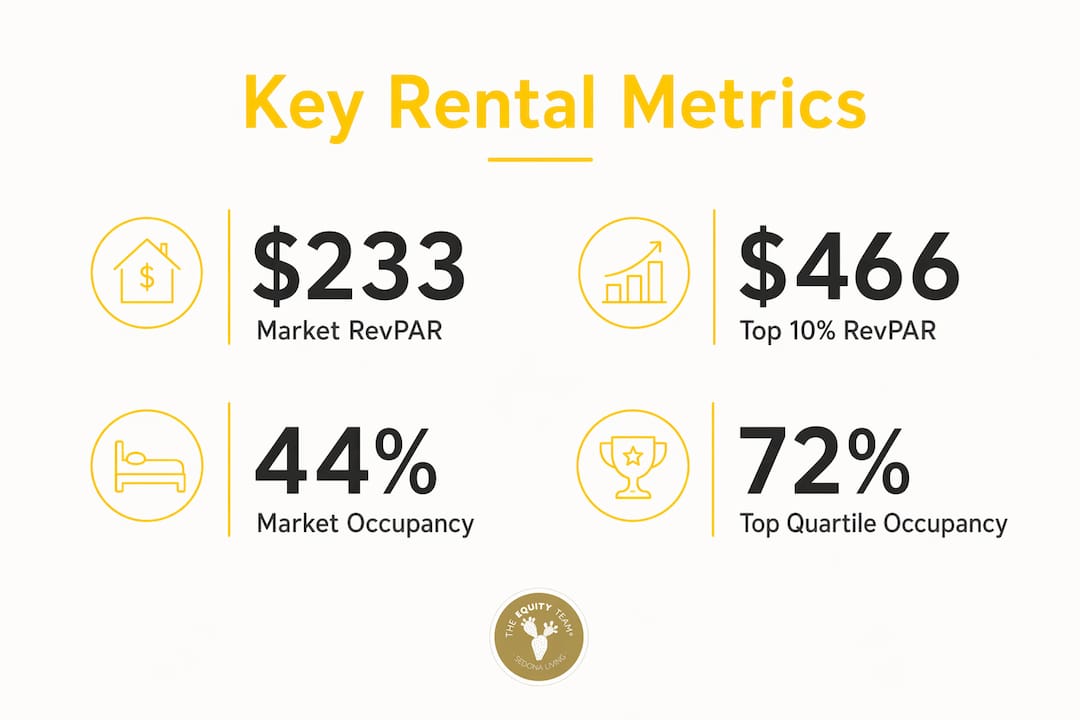
The market-wide RevPAR sits at $233, but that average hides a dramatic spread. Top 10% listings hit $466 in RevPAR, while the bottom 25% scrape by at $98. That gap tells you the Sedona market rewards operators who invest in quality, not just location.

Here is what the core metrics look like across the market right now:
| Metric | Market Average | Top Quartile |
|---|---|---|
| Annual gross revenue | $73,713–$83,895 | $95,208+ |
| Average daily rate (ADR) | $440–$450 | $546+ |
| Occupancy rate | 44%–49% | 72%+ |
| RevPAR | $233 | $466 |
A few things stand out from this data:
- ADR is high across the board. Even average Sedona listings command rates around $440, which reflects genuine demand for the destination.
- Occupancy is the differentiator. Top performers hit 72% occupancy versus 44% for the median. That gap alone accounts for most of the revenue difference.
- RevPAR benchmarks your efficiency. If a property you are evaluating sits below $233 RevPAR with no clear path to improvement, the numbers likely do not work.
Tracking these metrics against local Sedona data, rather than national STR averages, is what separates a good investment decision from a hopeful guess. The Sedona Airbnb market trends shift year to year, so pulling current figures before you run projections is non-negotiable.
How to calculate net rental income in Sedona
Gross revenue is the fun number. Net income is the real one. Here is a straightforward process for calculating what actually lands in your pocket.
- Start with gross annual revenue. Use the market average of $73,713–$83,895 as a baseline, or pull comp data for the specific property and neighborhood.
- Subtract operating expenses. Operating expenses run 25%–35% of gross revenue in Sedona. That covers property management, cleaning, supplies, insurance, utilities, and platform fees. On $80,000 gross, expect $20,000–$28,000 in expenses.
- Calculate net operating income (NOI). Subtract expenses from gross revenue. At 30% expenses on $80,000 gross, NOI lands around $56,000.
- Apply your debt service. With a typical Sedona home valued around $888,808, a standard mortgage payment will be substantial. Run your actual loan terms against the NOI.
- Check your DSCR. Lenders require rental income to cover at least 111% of debt payments. That means your NOI must exceed your annual debt service by at least 11%. Many median properties in Sedona do not clear this bar without strong occupancy.
The DSCR threshold is where average operators get stuck. Top quartile operators earning $95,208 annually with 72% occupancy and $546+ ADR can meet the 1.11 DSCR requirement. Median performers often cannot, which affects both financing options and cash flow. Understanding how DSCR works before you apply for a loan saves a lot of painful surprises.
Pro Tip: Run your NOI calculation at both the market average occupancy (44%) and the top quartile occupancy (72%). If the deal only works at 72%, you need a clear plan to get there before you close.
What property types and amenities drive Sedona STR income?
Property size and amenities are not just nice-to-haves in Sedona. They are the levers that move ADR and occupancy in measurable ways.
Five-bedroom homes achieve the highest occupancy and revenue in the Sedona market. They attract large family groups and corporate retreats willing to pay top dollar for the space. The catch is limited inventory, which means fewer comps and higher acquisition costs.
Three-bedroom properties make up about 25% of Sedona’s STR inventory. They hit a sweet spot between acquisition price, operating complexity, and guest demand. For most investors entering the market, a well-appointed three-bedroom with the right amenities outperforms a larger home that is poorly positioned.
Here is how property size stacks up on key dimensions:
| Property type | Revenue potential | Risk level | Inventory availability |
|---|---|---|---|
| Studio/1-bedroom | Lower | Lower | Moderate |
| 2–3 bedroom | Moderate to high | Moderate | High (25%+ of market) |
| 4–5 bedroom | Highest | Higher | Limited |
Amenities move the needle more than most investors expect. Properties with red rock views, private hot tubs, and professional management consistently command ADRs above $546 and occupancy above 72%. These are not luxury extras. They are the features that push a property from the median into the top quartile.
The guest persona matters too. Sedona attracts wellness travelers, couples on romantic getaways, and hiking enthusiasts. Properties designed around those experiences, with outdoor seating, spa-like bathrooms, and proximity to trailheads, fill calendars faster and earn better reviews.
How does Sedona’s seasonality shape your pricing strategy?
Sedona runs on two peaks, and understanding both is the foundation of any smart pricing strategy. The dual-peak season structure actually makes Sedona more attractive than single-season markets, because revenue is spread across more months of the year.
Here is how the calendar breaks down:
- Spring (march–april): Occupancy peaks at 72%. This is the busiest period, driven by wildflower season, comfortable temperatures, and spring break travel.
- Fall (october–november): ADR peaks at $471. Guests pay more per night during fall foliage season, even as occupancy runs slightly below the spring high.
- Summer (june–august): Occupancy drops to roughly 39%–41%. Heat drives away casual visitors, though wellness retreats and early morning hikers still book.
- Shoulder seasons (may, september, december–february): Mixed performance. Pricing strategy matters most here.
Peak season revenues can exceed $12,000 per month, while low season months can dip below $4,600. That is a wide swing, and it is exactly why static pricing destroys returns. Dynamic pricing tools adjust your rates daily based on local demand signals, competitor availability, and booking lead time. Operators who use them consistently outperform those who set rates once and forget them.
Pro Tip: Do not slash rates in summer to chase occupancy. A lower-priced listing in a slow season attracts lower-quality guests and erodes your review score. Hold a floor rate and focus on attracting the right guest, not just any guest.
What are common pitfalls when estimating Sedona rental income?
Investors who overestimate Sedona income potential almost always make the same mistakes. Recognizing them early saves real money.
- Projecting top-quartile occupancy on a median property. If the listing has no views, no hot tub, and average management, it will not hit 72% occupancy. Model at 44%–49% until you have data proving otherwise.
- Ignoring expense variability. Operating costs can swing from 25% to 35% of gross depending on management fees, maintenance cycles, and cleaning frequency. Use 30% as your baseline and stress-test at 35%.
- Underestimating the DSCR challenge. Sedona’s supply grew 62% between 2021 and 2026, pushing occupancy down from 68% to roughly 49% market-wide. More listings competing for the same guests means the financing math is tighter than it was three years ago.
- Skipping seasonal modeling. Running a flat annual occupancy number misses the reality that two months of the year can generate more revenue than four summer months combined.
- Benchmarking against national STR data. Sedona’s ADR and price points are far above national averages. Use local comps from the Sedona rental market to build projections that actually reflect what guests pay here.
The investors who get Sedona right are the ones who run conservative models first, then identify specific operational improvements that can push performance toward the top quartile.
Key Takeaways
Sedona STR income potential is real, but it rewards investors who model conservatively, invest in the right amenities, and manage operations at a top-quartile level.
| Point | Details |
|---|---|
| RevPAR is your core benchmark | Market-wide RevPAR is $233; top 10% listings hit $466, showing the performance gap. |
| Expenses eat 25%–35% of gross | Model at 30% baseline and stress-test at 35% before committing to a purchase. |
| DSCR qualification is the hurdle | Lenders require 1.11x coverage; only top-quartile operators reliably clear this bar. |
| Seasonality drives pricing strategy | Spring peaks at 72% occupancy; fall peaks at $471 ADR. Dynamic pricing captures both. |
| Amenities move ADR and occupancy | Red rock views, hot tubs, and professional management push properties into the top quartile. |
What I have learned about Sedona rental income after years in this market
The number I watch most closely is not ADR or occupancy. It is the gap between the median and the top quartile. Top 25% of Sedona listings earn $95,000+ annually versus a median of $54,852. That is not a small difference. It is nearly double, and it comes almost entirely from operational decisions, not location luck.
Most investors I talk to focus on finding the right property. That matters, but the operators who outperform consistently are the ones who treat their rental like a hospitality business. Professional photography, dynamic pricing, fast guest communication, and a hot tub that actually works on check-in day. These things compound over time into better reviews, higher occupancy, and guests who rebook.
The DSCR conversation also catches people off guard. Sedona homes are expensive, and lenders are not flexible on the 1.11 coverage requirement. I have seen investors fall in love with a property, run the gross revenue numbers, and completely miss that the net income does not cover debt service. Run the full financing model before you tour, not after.
One more thing: Sedona’s STR deed restrictions are real and vary by neighborhood. A property that looks perfect on paper can be legally off-limits for short-term rental. Check the deed before you do anything else.
— Chad
Sedona STR investing resources from Equity Team
Equity Team specializes exclusively in Sedona short-term rental investments and represents clients operating in the top 10% of the market. If you are ready to move from spreadsheets to a real acquisition, the next step is finding a property that can actually hit top-quartile numbers.

Equity Team’s guides walk you through finding the right STR property in Sedona with the metrics, neighborhood context, and financing realities already baked in. For investors who want to see what performing properties actually look like, the video walkthroughs and analyses by a local expert show real numbers on real listings. Equity Team is the first STR-specialized real estate team in Northern Arizona, and that focus shows up in every deal.
FAQ
What is the average annual STR revenue in Sedona?
The average annual gross revenue for a Sedona short-term rental runs between $73,713 and $83,895, with top quartile properties exceeding $95,000.
What ADR should I expect for a Sedona rental property?
Market-wide ADR in Sedona averages $440–$450 per night. Top-performing properties with premium amenities command ADRs above $546.
How does DSCR affect Sedona STR financing?
Lenders require a DSCR of at least 1.11, meaning rental income must cover 111% of debt payments. Sedona’s high home values, averaging around $888,808, make this threshold challenging for median-performing properties.
Which Sedona property types generate the most rental income?
Five-bedroom homes generate the highest revenue and occupancy, while three-bedroom properties balance risk and reward well, making up about 25% of the market’s STR inventory.
When is the best time to maximize Sedona rental income?
Spring (march–april) delivers peak occupancy at 72%, and fall (october–november) delivers peak ADR at $471. Dynamic pricing across both seasons is the most effective way to maximize annual revenue.