
An Airbnb investment analysis answers one question: after every bill is paid, does this house earn enough to justify the cash tied up in it? The method is simple. Estimate revenue from real comparable listings, subtract the full cost of running the place, then measure what is left against the money invested. The hard part is honesty, and Sedona, with its red rocks, its crystal shops and its gift for making spreadsheets look dreamy, tests that honesty harder than most markets.
This guide walks through the whole process: comps, RevPAR, the pro forma, the return metrics, the stress test and the Arizona tax rules. It includes a worked example with made-up numbers, so nobody mistakes it for a promise about a specific house.
TL;DR
- A solid analysis builds revenue from ADR and occupancy on 5 to 10 true comps, subtracts every operating cost to reach NOI, then checks cap rate, cash-on-cash return and DSCR.
- Sedona has a high revenue ceiling, but averages hide a wide spread. Top listings and the median listing live in different neighborhoods of the spreadsheet.
- Model three cases (base, conservative, stress) and find the break-even occupancy before falling in love with the view.
- Arizona transaction privilege tax and Sedona’s city permit are line items and gatekeepers, not afterthoughts.
- A local agent who works STR deals daily can pressure-test the numbers before an offer goes in.
Table of Contents
- What an Airbnb investment analysis actually measures
- Step 1: Start with the market, then get small
- Step 2: Build a comp set that holds up
- Step 3: Learn RevPAR, the number that keeps ADR honest
- Step 4: Build the pro forma
- A worked example, with invented numbers
- Step 5: Stress-test before the offer
- Arizona and Sedona rules that belong in the model
- Our perspective: the number on the page is a conversation starter
- Run the numbers on a real Sedona property
- FAQ
- Sources
What an Airbnb investment analysis actually measures
Strip away the jargon and the exercise has three layers. First, revenue potential: how many nights will book, and at what price. Second, operating performance: what it costs to turn those nights into guest-ready stays. Third, profitability against cash invested: whether the result beats the other places that money could sit.
The usual scoreboard has four numbers. NOI, cap rate, cash-on-cash return and DSCR separate the property’s yield from the effect of financing, and show the actual cash flow once the lender is paid. Each answers a different question, so no single one tells the whole story.
| Metric | What it tells you | Rough formula |
|---|---|---|
| NOI | Operating profit before financing | Gross revenue minus operating expenses |
| Cap rate | Unleveraged yield on the price | NOI divided by purchase price |
| Cash-on-cash return | Yield on the cash actually invested | Annual cash flow after debt service divided by cash invested |
| DSCR | Whether income covers the loan | NOI divided by annual debt service |
The definitions of gross revenue and NOI are straightforward: gross revenue is ADR times occupancy times 365, and NOI is that figure minus platform fees, cleaning, management, taxes, insurance, maintenance, utilities and supplies. Mortgage interest, principal and depreciation stay out of NOI, because they are financing and tax items, not operations.
One caution on cap rates. Comparing an STR’s cap rate to a long-term rental’s can mislead, because the STR’s costs are so different. The cleaner comparison is NOI after all the STR-specific costs. For the Sedona angle, our own breakdown of Sedona Airbnb cap rates goes deeper.
Step 1: Start with the market, then get small
Sedona is a quirky little market. One minute a listing is a serene casita with a hot tub and a canyon view, the next it is a six-bedroom showpiece that books like a boutique hotel. Market-level numbers are a starting point only.
For scale, data covering the 12 months to September 2026 puts the average Sedona listing at roughly $70,000 to $72,000 in annual revenue, with top performers earning well above that. Averages blend tiny studios with luxury estates, so the useful question is never what Sedona earns. It is what a house like this one, on a street like this one, earns.
For the bigger picture, our guides on Sedona Airbnb market trends and the current short-term rental climate in Sedona cover where demand sits today.
Step 2: Build a comp set that holds up
Short-term rental comps are the foundation of the whole model. Bad comps produce a gorgeous, useless number.
The common guidance is to compare 5 to 10 listings in the same submarket, matching bedrooms, amenities and quality. Then adjust for seasonality and lean on conservative occupancy, with the same source suggesting 55 to 65% rather than the optimistic averages that listing sites love to wave around.
In Sedona, a good comp set filters on:
- Location type: Uptown walkability, West Sedona, Village of Oak Creek, and red-rock-view streets are different animals.
- Size: Bedrooms, bathrooms and guest capacity. A sleeps-eight home does not comp against a sleeps-two cottage.
- Amenities that move rates: Hot tub, views, pool, EV charger, a patio built for sunset-watching.
- Quality and reviews: A tired listing with mediocre photos is a poor stand-in for a polished one.
- Operating history: A listing live for three weeks tells almost nothing.
Two habits keep the comps honest. Pull booked nights, not just asking rates, because a $600 nightly price that never books is a decoration. And look at the whole year, not the spring-break glow. Our guide to Sedona STR occupancy data explains how to read the seasonal swings, and how to evaluate Sedona rental income potential shows the comp work step by step.
A listing-site calculator is a fine first pass. An agent’s comparative market analysis built from local sales and actual STR performance is the second pass. That is what our vacation rental CMA is for.
Step 3: Learn RevPAR, the number that keeps ADR honest
ADR alone flatters. Occupancy alone flatters differently. RevPAR, revenue per available night, combines the two and measures revenue generated for every available night, so listings can be compared on pricing power balanced against booking performance.
The math is delightfully short: RevPAR equals ADR times occupancy. Total revenue divided by available nights gives the same answer.
Here is why it matters. Two imaginary Sedona listings:
| Listing A | Listing B | |
|---|---|---|
| ADR | $520 | $380 |
| Occupancy | 38% | 62% |
| RevPAR | $197.60 | $235.60 |
Listing A sounds glamorous. Listing B earns more per available night, and its guests also create more cleanings, which is a cost to count. RevPAR starts the conversation, and the expense model finishes it.
Step 4: Build the pro forma
A pro forma is a forward-looking projection made before the purchase. A good one estimates gross revenue, operating expenses, NOI, debt service and returns, and uses several scenarios rather than a single point estimate.
A workable structure, based on a standard STR pro forma template:
- Revenue: market-calibrated ADR, occupancy from comps, gross annual revenue and monthly seasonality.
- Operating expenses: management, cleaning, property taxes, HOA, insurance, utilities, supplies and maintenance.
- Acquisition and financing: purchase price, down payment, loan terms, monthly principal, interest, taxes and insurance, plus closing and setup costs.
- Outputs: NOI, cap rate, cash-on-cash return, IRR, break-even occupancy and DSCR.
- Scenarios: base, conservative and stress.
The costs that ambush first-time investors
A few line items deserve extra attention:
- Cleaning: turnover cleaning commonly runs $85 to $175 per stay. Guests usually pay a cleaning fee, but the fee can push the nightly total up and booking down, so model it as a cost first.
- Utilities: the same source says they often run 15 to 25% above long-term rental levels. Hot tubs and red-rock-view air conditioning add up.
- Capital reserves: the same guide suggests setting aside 8 to 12% of gross revenue for replacing the mattresses, the sofa and eventually the roof.
- Management: self-managing is not free. It costs time. Before choosing, it helps to see what property management fees actually cost in total, not only the headline percentage.
- Startup costs: furniture, linens, photography, smart locks and the first round of supplies.
One upside line is worth modeling carefully: professional cleaners, channel managers and dynamic pricing software are often part of effective management, and one industry glossary reports dynamic pricing can lift annual revenue by 15 to 25% over static pricing. Treat that as a ceiling to test, not a base-case assumption. Our vacation rental revenue management playbook covers the pricing side.
A worked example, with invented numbers
The numbers below are hypothetical. They are not a Sedona listing, a forecast or a guarantee. They show the mechanics.
Assumptions: a three-bedroom home priced at $1,100,000. ADR of $400. Occupancy of 55%. Operating expenses (fees, cleaning, management, taxes, insurance, utilities, supplies, maintenance) of 45% of gross revenue. A 25% down payment, a $825,000 loan at 7% over 30 years, and $60,000 for closing costs and furnishing.
| Line | Result |
|---|---|
| Gross revenue ($400 × 55% × 365) | $80,300 |
| RevPAR ($400 × 55%) | $220 |
| Operating expenses (45%) | $36,135 |
| NOI | $44,165 |
| Cap rate (NOI ÷ $1,100,000) | about 4.0% |
| Annual debt service (approx.) | about $65,900 |
| DSCR | about 0.67 |
| Annual cash flow after debt | about negative $21,700 |
| Cash invested ($275,000 down + $60,000) | $335,000 |
| Cash-on-cash return | about negative 6.5% |
Now the interesting bit. Push occupancy to 65% and the same house grosses $94,900, NOI rises to about $52,200, and DSCR climbs to roughly 0.79. Still under 1.0. A lovely house, a gorgeous view, and a deal that does not work at this price and this loan.
That is exactly what the analysis is for. It does not say never buy. It says what would have to change: a lower price, more cash down, a better rate, a higher-earning layout, or revenue that real comps support. Sometimes lower cash flow can still make sense when the investor has other goals, but that should be a decision made with eyes open, not a surprise at the first mortgage statement.
Step 5: Stress-test before the offer
One of the most common first-time investor mistakes is overestimating occupancy or nightly rates, which inflates revenue and cash flow on paper. The fix is a stress test. Calculate three things:
- Break-even occupancy: the occupancy at which cash flow hits zero.
- Minimum ADR: the lowest nightly rate that keeps cash flow positive.
- The debt-service line: the point where NOI stops covering the loan.
Then run the ugly months. Sedona’s summer heat and winter lulls are real, and a few soft quarters, a roof repair or a regulation change should not sink the plan. A rental stress test calculator is a quick way to see how cash flow behaves when performance weakens.
A simple rule: if the deal only works in the base case, it does not work. If it survives the conservative case with the lender paid and a cash cushion intact, it is worth a serious look.
Arizona and Sedona rules that belong in the model
Regulation is a cost and a risk. A few anchors for Arizona:
- Transaction privilege tax: Arizona requires STR operators to collect and remit TPT on lodging stays of less than 30 days, under business codes 025 for state and county and 044 for city.
- Booking platforms: owners who rent through an online lodging marketplace report 100% of the income but deduct it using code 775, because the marketplace remits the tax.
- Longer stays: since January 1, 2025, residential rental TPT on stays of 30 days or more is no longer collected or remitted. That matters for mid-term rental fallback plans.
- City permit: Sedona operators need a TPT license first, then a city permit, along with insurance, safety and neighbor-notification requirements.
Rules change, so check the Arizona Department of Revenue and the City of Sedona for the current requirements before closing. For tax questions on a specific property, a CPA who knows Arizona lodging tax is the right call. For the sell-side angle, see how to prepare a Sedona rental for sale and avoid tax traps.
Our perspective: the number on the page is a conversation starter
We are a team of agents that works short-term rental deals in Sedona and Northern Arizona, and we represent owners who run STRs in the top 10% of the rental market. Here is what that daily work has taught us.
First, the property is only half the story. Two houses on the same street can earn very different numbers, because the better one has the right photos, the right pricing discipline and the right guest experience. When we analyze a home, we ask whether the current performance is the ceiling, the floor or an accident.
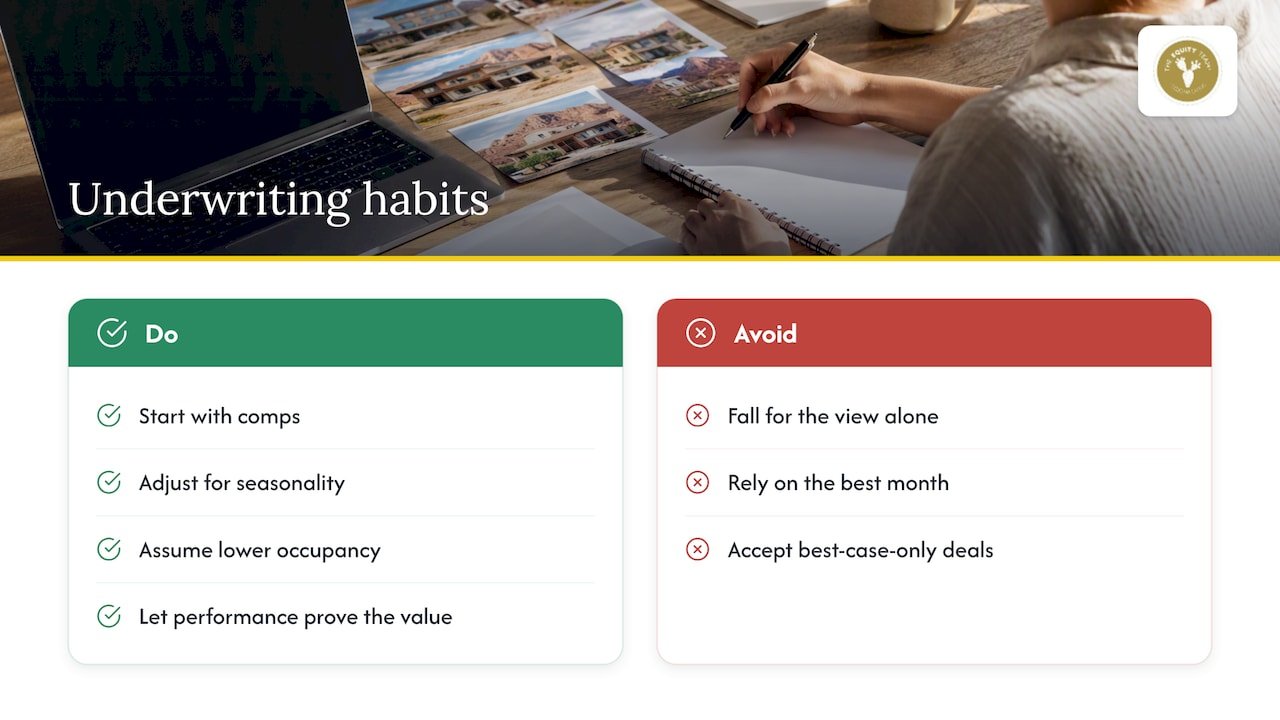
Second, buyers fall for the view and sellers fall for the best month. Both are human, and both are expensive. The fix is the same: start with comps, adjust for seasonality, assume less occupancy than feels fair, and let the property earn its way back up.
Third, an analysis cuts both ways. Buyers use it to avoid overpaying. Owners use it to decide whether to hold, improve or sell. Our exit strategy and valuation conversation exists for that last group, and our guide to luxury rental investing explains why even high occupancy still needs a local CMA.
If a deal only pencils in the best-case column, we say so. Better a candid spreadsheet today than a surprised owner next spring.
— Chad
Run the numbers on a real Sedona property
Buying? We can help build the comp set and pro forma for homes on your shortlist, or help find the right fit through our approach to finding the right Sedona short-term rental investment. Owners thinking about selling can request a Sedona vacation rental CMA and seller prep consultation, and anyone who wants to start with the basics can head to the Equity Team home page. To ballpark value first, our Sedona Airbnb valuation guide is a good start.
FAQ
Are Airbnbs a good investment right now?
Some are, and many are not, which is why the analysis exists. Sedona’s revenue ceiling is high, with the average listing around $70,000 to $72,000 a year in the 12 months to September 2026. But price, financing and operating costs decide whether a given house clears its debt. Run the numbers on comps and stress them before buying.
What is the difference between cap rate and cash-on-cash return?
Cap rate is NOI divided by purchase price and ignores financing, so it compares properties on equal footing. Cash-on-cash return measures annual cash flow after debt service against the cash you actually put in. A deal can have a decent cap rate and a poor cash-on-cash return if the loan is expensive.
How many comps do I need for an STR analysis?
Aim for 5 to 10 similar listings in the same submarket, matched on bedrooms, amenities and quality. Fewer than five risks leaning on one outlier. More than ten usually means the set has drifted away from the property being analyzed.
Do I owe Arizona tax on short-term rental income?
Yes, lodging stays of less than 30 days are subject to transaction privilege tax. If a booking platform collects and remits it, owners still report the income and use the proper deduction code. A CPA familiar with Arizona lodging tax can confirm how it applies to a specific property.
Sources
- Airbnb Investment Analysis: How to Evaluate a Deal
- How to Calculate Short-Term Rental ROI
- Best Airbnb Markets in the US (2026)
- Complete Guide to Short-Term Rental Investing
- What Is Pro Forma in Short-Term Rentals
- Airbnb and Vacation Rental Pro Forma Template
- Pro Forma in Real Estate: A Guide for Airbnb Hosts
- STR Investment: Short-Term Rental Returns Explained
- Property Management Fees for Owners
- Rental Stress Test for Investors
- Short-Term Lodging, Arizona Department of Revenue
- Residential Rental Licensing Requirements and Processes
- Sedona Short-Term Rental Regulations